
Make rate by distance

From which distances do you actually hole your putts, and is that good for your level?

In the app: Putting Make %

What it measures

  • Putts holed divided by putts attempted, one bar per distance: 3, 6, 9 and 15 ft, then lag bands from 20 ft out.
  • A bar appears once a distance has 10 attempts. Distances with fewer are named above the chart instead of being drawn.
  • Each bar carries markers for your own level and for PGA Tour players. A table compares the period you select with the period before it.

How it helps you

It replaces "I feel shaky on short putts" with a number you can compare, and a distance to work on.

It separates a real weakness from a normal drop-off. Holing four in ten from 6 ft is on the marker for an average amateur, not a problem.

Drills behind this insight

Record any of these in the app and this insight updates when you save the session.

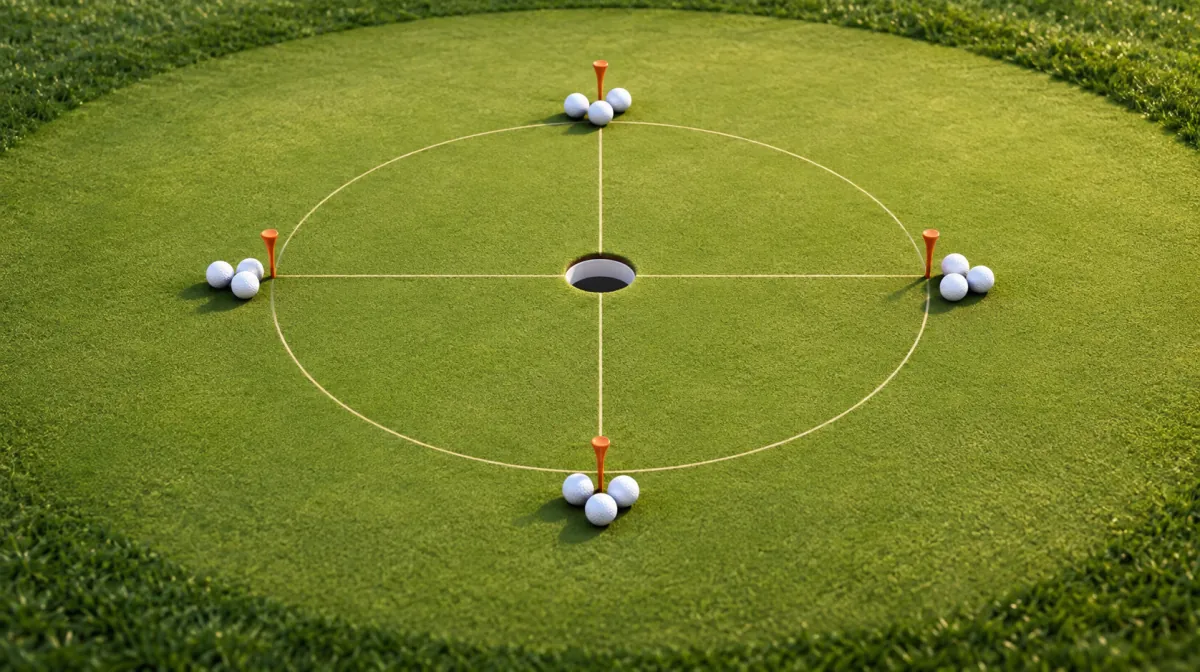
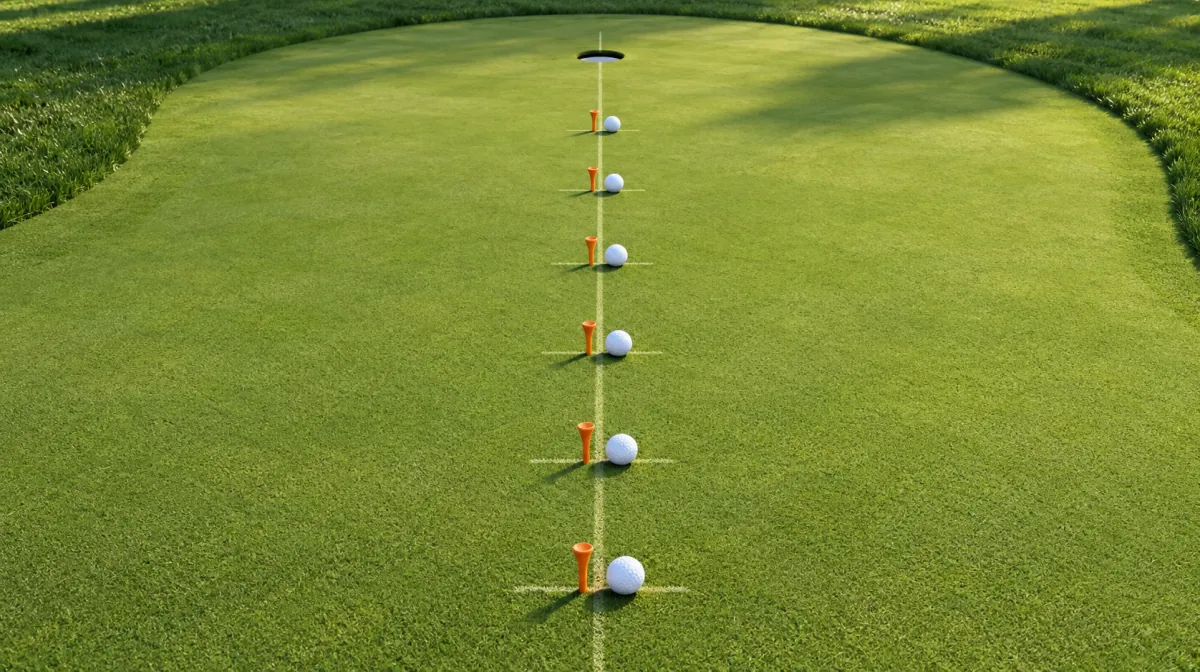
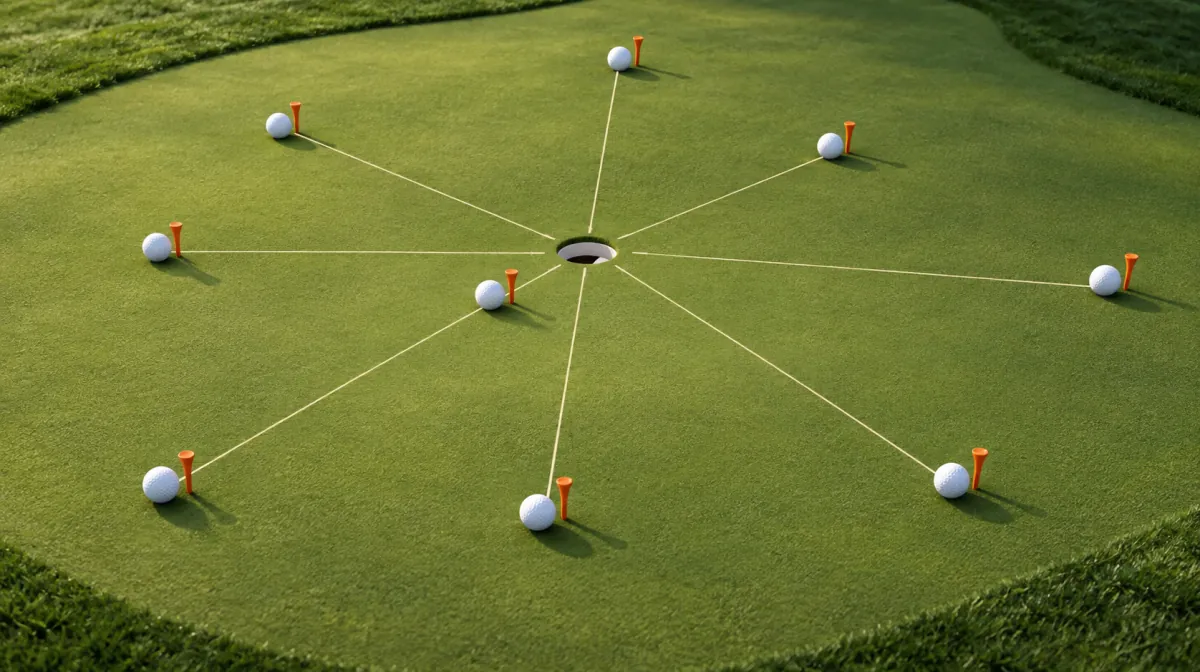
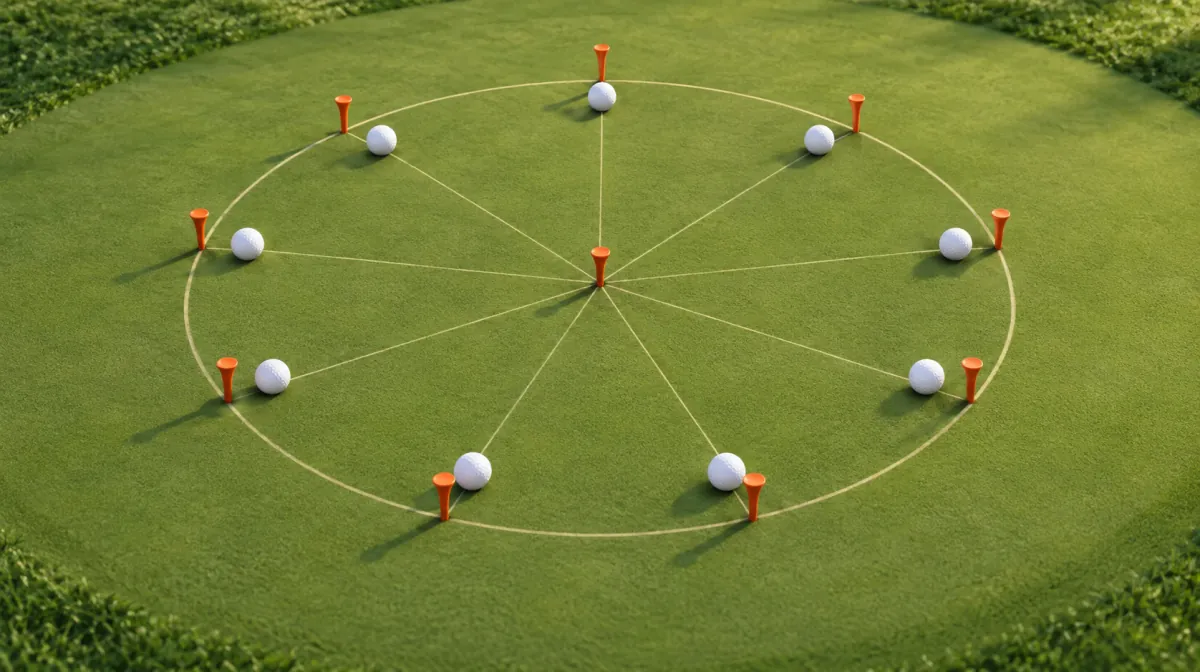
Every scoring option counts here, because each one records whether the putt went in. Gate Drill does not: its strokes are gate passes, not attempts at the hole.

Examples, and what the coach says

Example 1

One distance sits below the marker

An Average-level player with 40 recorded putts at each of three distances and 36 at a fourth.

Make rate by distance
Benchmark for your level (Average)
3 ft
75 % 30 of 40
6 ft
30 % 12 of 40
9 ft
22 % 8 of 36
15 ft
13 % 5 of 40

How to read it

  • Bars fall as distance grows. That is normal, so never compare one bar with the next.
  • Compare each bar with its own marker. Only 6 ft ends clearly short of it, by 10 points.
  • 9 and 15 ft look weak at a glance but are right on the marker.
AI coachFocus: Putts from 6 ft

You hole 30 % from 6 ft, 10 points below the 40 % for your level. Your other distances are on or above their markers, so this is where putting costs you. It is also a typical length to have left after a decent chip.

Next session: Make 6 ft the main block of your next session. Run the Ladder Drill on the Points option, so your misses at that distance get a direction too.

Example 2

Good numbers, and one you cannot trust yet

An Advanced-level player. Three distances have plenty of putts, the longest only six.

Make rate by distance
Benchmark for your level (Advanced)
3 ft
90 % 36 of 40
6 ft
55 % 22 of 40
9 ft
33 % 13 of 40
15 ft
6 of 10 putts recorded, not enough to show yet

How to read it

  • All three bars pass their markers, so no distance is holding this player back.
  • 15 ft has no bar. Three makes from six would read as 50 %, far above any benchmark, and it would be luck.
  • The chart waits for 10 putts and tells you how many are missing, so a good afternoon never looks like a trend.
AI coachFocus: Find your edge further back

You are ahead of your level at every distance with enough data, so more short putts will not move much. The six putts from 15 ft say nothing yet.

Next session: Record at least four more from 15 ft. Putting Map moves you around the hole at distance, which also fills in your Break map.

All numbers here are illustrative sample data, and the coach notes show the kind of advice you get. In the app, the AI coach reads all your putting data and gives you one focus with its reasoning, based on your own sessions. Each chart also has a one-line takeaway of its own.